JavaScript Authoring Workflow: From the In-Browser Editing Dream to Modern Real-Time Tooling
In software engineering, “coding” and the “authoring workflow” represent two very different dimensions.
Coding simply describes typing syntax into a file. The authoring workflow, on the other hand, encompasses the entire dynamic feedback loop—from conceptualizing an idea and writing code to compiling/transpiling, observing execution in runtime, spotting anomalies, and debugging with precision.
Historically, what drains a frontend engineer’s cognitive energy the most is rarely algorithmic complexity—it is the pervasive friction within this feedback loop.
Back in 2013, Paul Irish from the Google Chrome team delivered a seminal talk at the O’Reilly Fluent Conference: “JavaScript Authoring Tooling.” That presentation marked the beginning of a revolution in frontend development habits.
Talk Archive: Fluent 2013 - Paul Irish: JavaScript Authoring Tooling
What made this presentation so influential was that it tackled frontend engineering’s most agonizing pain points head-on: context switching and fractured toolchains.
1. The Friction Before 2013: The Five-Step Loop
Before the arrival of Chrome DevTools Workspaces and modern hot-reloading architectures, web developers worldwide repeated a tedious five-step ritual every day:
flowchart TD
    A1["1. Write code in editor (Sublime Text / Vim)"] --> A2["2. Save file (Cmd + S)"]
    A2 --> A3["3. Switch window to browser (Alt + Tab)"]
    A3 --> A4["4. Manual reload (F5 / Cmd + R)"]
    A4 --> A5["5. Full page reload: all UI state lost"]
    A5 --> A6["6. Click around to reproduce scenario & inspect DevTools"]
    A6 --> A1
This loop suffered from three fatal flaws:
- Destroying Developer Flow State: Cognitive psychology demonstrates that every window switch and micro-delay introduces distraction. Constantly toggling between code editor and browser severely drains focus and mental clarity.
- Total Loss of Transient UI State: Imagine debugging an interaction nested three modals deep, with specific checkboxes ticked and a complex multi-step form half-filled. A full browser reload instantly wipes runtime memory, forcing you to manually re-click through multiple steps just to get back to the scene of the bug.
- The Chasm Between Source Code and Runtime Output: As Sass/Less preprocessors and CoffeeScript gained traction in 2013, frontend code required compilation. When errors occurred in the browser, developers were greeted by minified, unreadable blobs of compiled code, with no clear correlation to their handwritten source lines.
2. The 2013 Breakthrough: The Chrome DevTools Workspace Vision
To dismantle this exhausting loop, the Chrome DevTools team (including Paul Irish and Addy Osmani) proposed an audacious idea: Why not turn the browser itself into your primary IDE?
The centerpiece of this philosophy was Chrome DevTools Workspaces.
flowchart LR
    subgraph DevTools2013 ["2013: Chrome DevTools Bi-Directional Mapping"]
        direction TB
        Disk["Local Filesystem"] <== "Bi-directional Mapping" ==> Workspace["DevTools Workspace<br/>(Sources Panel Editing)"]
        Workspace -->|"Live Save & Style Replacement<br/>(Live CSS & Source Maps)"| V8["Browser Runtime<br/>(DOM & V8 Engine)"]
    end
Three Major Technological Innovations:
1. Filesystem Mapping
Previously, the Sources panel in DevTools was merely a read-only debugging mirror. With Workspaces, developers could drag their local project directory directly into DevTools.
The browser established a bi-directional mapping between network resources (http://localhost:3000/app.js) and local disk files (/path/to/project/app.js). Pressing Cmd + S in DevTools Sources wrote changes directly back to your physical drive.
Back in 2013, enabling this experimental capability required diving into Chrome’s hidden flags:
Navigate to
chrome://flags(formerlyabout:flags), scroll down to find Experimental Developer Tools, enable it, and restart Chrome. An “Experiments” tab would then appear in DevTools Settings.
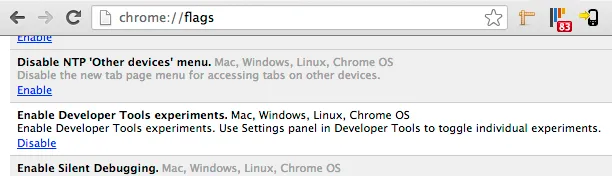 Figure: The classic 2013 Chrome Experimental Developer Tools flag (now an integral built-in feature under DevTools Settings → Workspace).
2. Live CSS Injection
Modifying CSS properties in the Elements or Sources panel did not trigger a page reload. DevTools hot-swapped stylesheets in memory, prompting immediate recalculation of the render tree and instant repainting.
3. Standardized Source Maps
DevTools introduced robust support for Source Maps (Base64 VLQ encoded). Even when running transpiled or minified code in production-like environments, DevTools mapped breakpoints seamlessly back to original Sass, TypeScript, or CoffeeScript files.
3. Retrospective: Why Didn’t “The Browser as IDE” Rule the World?
Looking back, although the movement to turn DevTools into a full-fledged IDE pushed web debugging forward dramatically, developers did not abandon dedicated code editors. Why?
- The Moat of Specialized Editors: The raw speed of Sublime Text, the elegance of TextMate, and later the LSP (Language Server Protocol) and AST static analysis championed by VS Code raised the bar. Specialized code editors offered auto-completion, refactoring, Git integration, and plugin ecosystems that a browser panel simply could not match.
- The Explosion of Modern Frontend Build Pipelines: Post-2015, frontend architecture shifted with React, Vue, Webpack, Babel, and ES Modules. Code ceased to be simple static files; it became an intricate compilation tree with JSX, CSS Modules, TypeScript, and environment variables. Editing bundled outputs inside a browser and saving them back to disk broke upstream compilation workflows.
Yet, the core ethos Paul Irish championed—zero-latency feedback, runtime state preservation, and zero context switching—never vanished. Instead, it was absorbed directly into our modern tooling foundation.
4. The Modern Renaissance: The 2020s Authoring Workflow
A decade later, the modern frontend authoring workflow has synthesized into an integrated architecture uniting specialized editors, lightning-fast dev servers, and bi-directional debugging protocols:
flowchart TD
    subgraph ModernWorkflow ["Modern Authoring Workflow Architecture (Vite + HMR + CDP)"]
        direction TB
        Editor["Dedicated Modern Editor (VS Code / Cursor)<br/>• LSP Type Inference<br/>• ESLint / Prettier On-Save"]
        DevServer["Modern Dev Server (Vite / Turbopack)<br/>• Unbundled Native ESM<br/>• Sub-millisecond esbuild / SWC Compilation"]
        BrowserRuntime["Browser Runtime (Chrome / Edge)<br/>• React / Vue Fast Refresh<br/>• In-Memory UI State Preserved"]

        Editor -- "File Changes (Save)" --> DevServer
        DevServer -- "WebSocket Push (HMR Patch)" --> BrowserRuntime
        BrowserRuntime <== "Chrome DevTools Protocol (CDP)<br/>Bi-directional Breakpoints & State Inspection" ==> Editor
    end
The Three Pillars of Modern Workflows:
| Dimension | 2013 Model (DevTools Workspace) | Modern Model (Vite / Next.js / VS Code) |
|---|---|---|
| Primary Editing Canvas | In-Browser DevTools Sources | Dedicated IDE (VS Code / Cursor) powered by LSP |
| Code Delivery | Save directly to disk from browser | Editor save → Native ESM / WebSocket broadcast |
| State Preservation | Manual DOM mutation or pure CSS injection | Hot Module Replacement (HMR) + Fast Refresh |
| Debugging Pipeline | Unidirectional inside DevTools | Chrome DevTools Protocol (CDP) debugging directly inside editor |
| Production Overrides | Manual file system mapping | DevTools Local Overrides (instant mocking of APIs and scripts) |
1. Hot Module Replacement (HMR) and Fast Refresh
Today’s hot replacement goes far beyond CSS injection. With React Fast Refresh or Vue HMR, when you modify business logic or layout in a child component, the dev server sends only the delta patch across a WebSocket. The browser replaces that component’s rendering function in place while completely preserving form inputs, scroll positions, and state stores (Redux, Zustand, Vuex). No page reload, no lost form data.
2. Bi-Directional Protocol: Chrome DevTools Protocol (CDP)
Developers no longer have to choose between browser and editor. Through CDP, VS Code attaches directly to Chrome’s debugging core. Setting a breakpoint on line 42 of a TypeScript file in VS Code pauses execution in the browser, mirroring call stacks and lexical variables right back in the editor.
3. Local Overrides: The Heir to Workspaces
In modern Chrome DevTools, the Workspace philosophy survives in Local Overrides. When diagnosing critical production issues, you can override any production script or API response directly within DevTools. The browser prioritizes your local edits over the remote server, making live debugging effortless.
Conclusion: Great Workflows Collapse the Distance to Feedback
Revisiting Paul Irish’s 2013 presentation on the JavaScript Authoring Workflow reminds us that tooling advances are ultimately about human-machine synergy.
From manual F5 refreshes, to DevTools Workspace filesystem binding, to modern Vite ESM pipelines and CDP integrations, tools will continue to evolve. Yet the guiding beacon of an exceptional authoring workflow remains unchanged:
Compress the distance between writing code and validating results to zero, keeping the developer’s mind completely immersed in creative flow.